Neff calcularion and field plotting#
This example shows the basic usage of REMSOL package, namely the calculation of the effective refractive index and the field plotting.
Importing packages#
Besides REMSOL itself, it is also useful to import the Polarization enum for choosing the polarization of the mode.
import numpy as np
import matplotlib.pyplot as plt
import remsol
from remsol import Polarization as pol
Definiton of the waveguide#
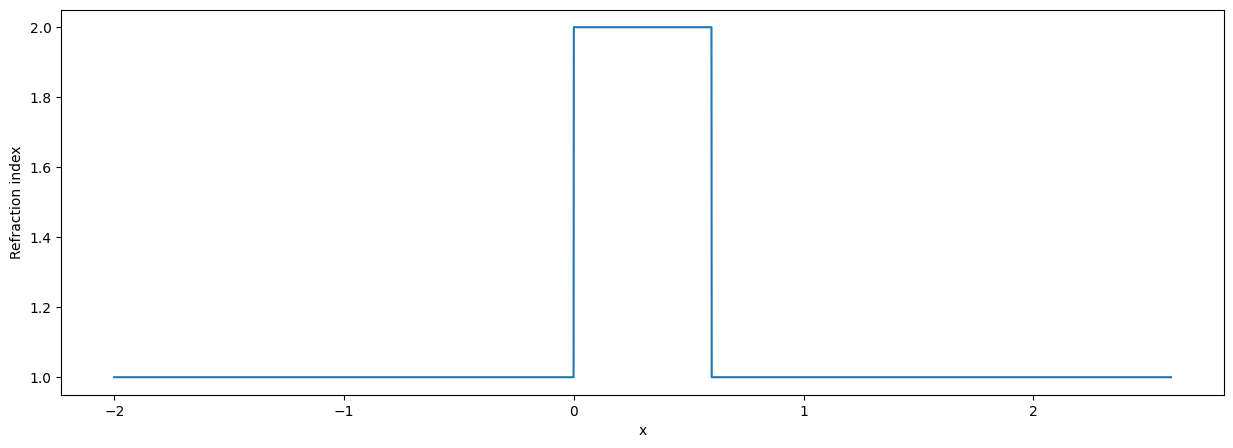
This example features a simple slab waveguide with a refractive index of 2.0 suspended in air (refractive index of 1.0). The code works in adimensional units, but for typical optical application the lengths can be thought of as micrometers. The thickness of the slab is thus set as 0.6. The thicknesses ot the first and last layers are irrelevant for the calculations and are only used to define the plotting window.
multi_layer = remsol.MultiLayer(
    [
        remsol.Layer(n=1.0, d=2.0),
        remsol.Layer(n=2.0, d=0.6),
        remsol.Layer(n=1.0, d=2.0)
    ]
)
Plotting index profile#
The index profile can be obtained by calling the index method of the MultiLayer object.
index = multi_layer.index()
fig, ax = plt.subplots(1, 1, figsize=(15, 5))
ax.plot(index.x, index.n)
ax.set_xlabel('x')
ax.set_ylabel('Refraction index')
Text(0, 0.5, 'Refraction index')

Calculation of the effective index and filed plotting#
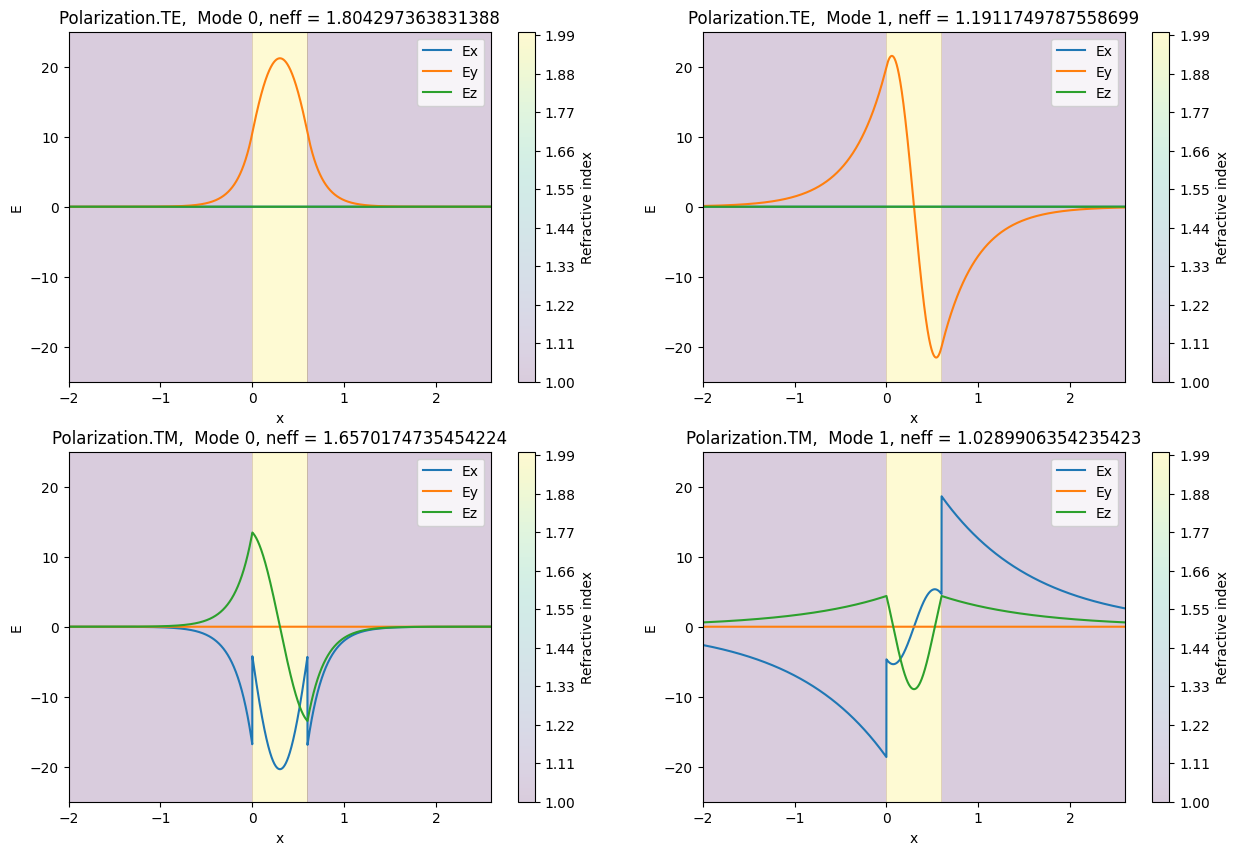
The effective index can be calculated calling the neff method of the MultiLayer object. If the requested mode is not found, and exception is raised. The parameter omega is the angular frequency of the mode. It is also in adimensional units, but can be thought of as \(2\pi /\lambda\), where \(\lambda\) is the wavelength in the same length unit used to define the structure.
The filed can be obtained by calling the field method of the MultiLayer object. The returned object is FieldData object containing the all the components of the E and H as attributes. By default, the multilayer is stacked in the x direction, z is the direction of propagation and y is the transverse direction.
index = multi_layer.index()
X, I = np.meshgrid(index.x, [-25.0, 25.0], indexing="ij")
N, I = np.meshgrid(index.n, [-25.0, 25.0], indexing="ij")

fig, ax = plt.subplots(2,2, figsize=(15,10))

for polarization, _ax in zip([pol.TE, pol.TM], ax):
    for mode, a in enumerate(_ax):
        neff = multi_layer.neff(omega=2.0 * np.pi / 1.55, polarization=polarization, mode=mode)
        field = multi_layer.field(omega=2.0 * np.pi / 1.55, polarization=polarization, mode=mode)
        _=a.contourf(X, I, N, levels=100, cmap="viridis", alpha=0.2)
        cbar = plt.colorbar(_)
        cbar.set_label("Refractive index")
        a.plot(field.x, np.real(field.Ex) + np.imag(field.Ex), label="Ex")
        a.plot(field.x, np.real(field.Ey) + np.imag(field.Ey), label="Ey")
        a.plot(field.x, np.real(field.Ez) + np.imag(field.Ez), label="Ez")
        a.legend()
        a.set_title(f"{polarization},  Mode {mode}, neff = {neff}")
        a.set_xlabel("x")
        a.set_ylabel("E")

